


Auto-scaling Druid with Kubernetes

Jul 16, 2019
Never miss our publications about Open Source, big data and distributed systems, low frequency of one email every two months.
Apache Druid is an open-source analytics data store which could leverage the auto-scaling abilities of Kubernetes due to its distributed nature and its reliance on memory. I was inspired by the talk ”Apache Druid Auto Scale-out/in for Streaming Data Ingestion on Kubernetes” by Jinchul Kim during DataWorks Summit 2019 Europe in Barcelona.
Druid
Druid is a column-oriented, open-source, distributed data store commonly used in business intelligence/OLAP applications to analyze high volumes of real-time and historical data. It can be seen as a mix between a search engine like Apache Solr and Elasticsearch, a time-series Database (TSDB) like Prometheus, OpenTSDB and an OLAP Database. It is currently incubating to become a top-level Apache project. A Druid cluster is fragmented in multiple roles/services which are designed to be highly scalable. Most importantly, because of the specificities of its architecture and implementation, Druid is really fast when it comes to specific use cases.
Rollup ingestion
Druid has a pre-aggregation feature called the “Rollup”. At ingestion time, the system will not store individual records. Instead, it stores aggregations of these records based on the dimensions of the data as we can see in this example:
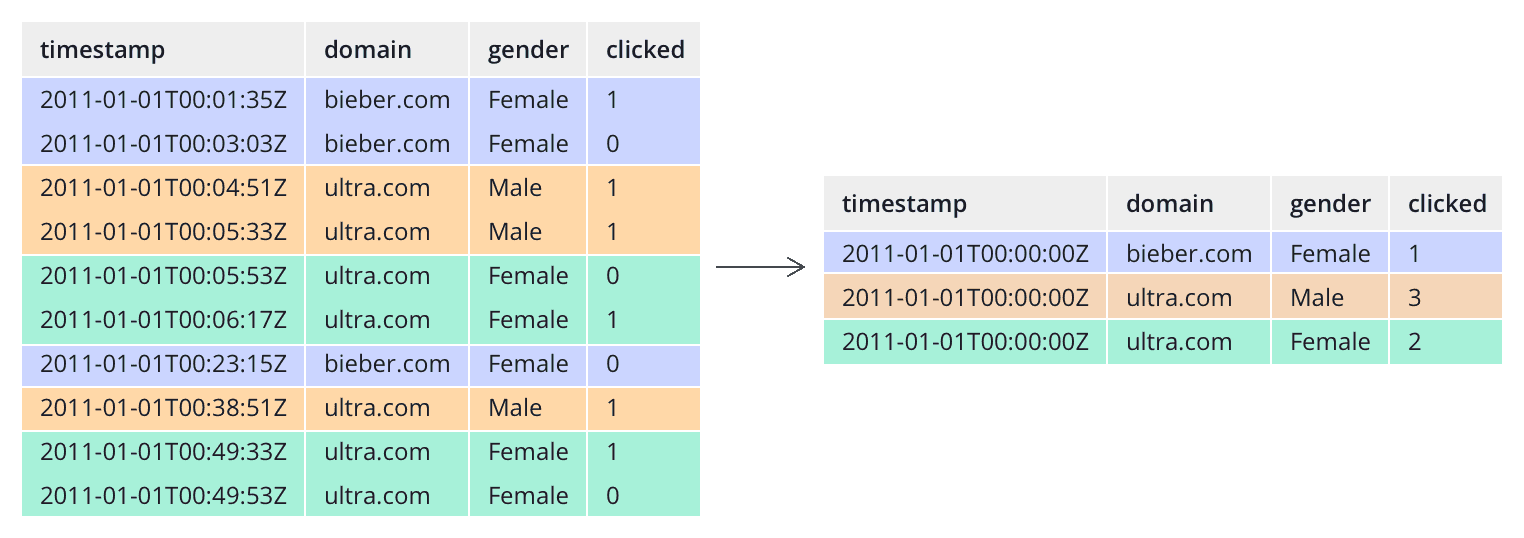
These records are stored as segments in a columnar fashion. The combination of these two features is what makes Druid so fast for analytics queries such as counts or groupBys because the data was already computed at ingestion time. The columnar orientation is also practical because it only reads the data it needs to answer the query.
Roles
A Druid installation is made of multiple services designed to run on a distributed, cloud-friendly architecture.
- Middlemanager: Responsible for ingesting data, reading from external data sources into segments. This is the service we will focus on in this article trying to automatically scale it with Kubernetes.
- Historical: Handle the storage and answer the queries on data already ingested (ie: historical data).
- Broker: Receive both ingestion and querying requests and forward them to the right service (Historical or Middlemanager).
- Overlord: Deal with the assignation of ingestion tasks to the Middlemanager nodes.
- Coordinator: Deal with the balancing of the segments across the cluster’s Historical nodes.
It might seem complex at first sight but with a little practice of Druid, every role will seem like a no-brainer.
Auto-scaling
Druid has a built-in auto-scaling ability but unfortunately, the only implementation at the time of this writing is coupled with Amazon EC2. There is a real need for Druid clusters to support auto-scaling in complementary environments such as for other Cloud providers and on native Kubernetes platforms.
Kubernetes
Kubernetes (K8s) is a container orchestrator. If you are not too familiar with Kubernetes or wish to get a refresh, I invite you to read Arthur’s excellent article “Installing Kubernetes on CentOS 7”. One aspect of Kubernetes that is not covered in his article is the ability to do auto-scaling. Let’s see how this works.
Horizontal Pod Autoscaler
Horizontal Pod Autoscaler (HPA) is a feature that allows a user to let Kubernetes automatically increase or decrease the number of pods in a Replication Controller, Deployment or ReplicaSet. It is based by default on CPU usage using the metrics.k8s.io API provided by metrics-server (since Heapster as been deprecated) and can be extended with user-defined custom metrics using the custom.metrics.k8s.io API.
The default algorithm for deciding the number of replicas is the following:
desiredReplicas = ceil[currentReplicas * ( currentMetricValue / desiredMetricValue )]Example in a Druid context:
The Middlemanagers are responsible for doing the ingestion in forms of tasks. As tasks are done by a Middlemanager one at a time, we can declare a Druid installation with many pending tasks (ie: tasks waiting for a Middlemanager to be available) to not be scaled properly.
With:
- currentReplicas: number of Middle managers, 3 in the beginning.
- desiredMetricValue: number of pending tasks that we want, let’s decide 5 is acceptable.
- currentMetricValue: number of pending tasks, at the moment of computation 10.
desiredReplicas = ceil[3 * (10 / 5)] = 6In this example, Kubernetes will scale up by the Middlemanager pods times 2, resulting in 6 Middlemanagers to handle the workload.
With this formula, zero pending tasks would lead to zero replicas of the Middlemanager which is obviously not what we want. Kubernetes is able to set a hard limit minimum for us as we will see in the demo part of the article.
Custom Metrics API
Kuberenetes provides an API for user-defined metrics. This API can be implemented to serve custom metrics that can be used for Kubernetes’ built-in capabilities, in our case we are interested in using these with the HPA.
There are a few implementations available known as “adapters”. We will use the Prometheus adapter designed by DirectXMan12. Prometheus is Cloud Native Computing Foundation (CNCF) project has become a standard in terms of metrics scraping, parsing, and database.
It is also worth to mention that there is a boilerplate if you wish to implement your own Custom Metrics API.
Demo
For this demo, I deployed a 3 workers Kubernetes cluster by following Arthur’s tutorial. I also installed a Druid cluster on this Kubernetes using Helm’s Druid chart. Helm is a package manager for Kubernetes that simplifies a lot of things. It helps us deploys commons apps in Kubernetes without reinventing the wheel.
I deployed a Druid cluster using the incubating Helm chart. Here is a look at our cluster:
kubectl get pods -n druid -o wide
NAME READY STATUS RESTARTS AGE IP NOMINATED NODE READINESS GATES
druid-broker-5c6b4dd495-ppmvx 1/1 Running 2 65m 10.244.3.141 <none> <none>
druid-coordinator-748f4fd656-vkvjq 1/1 Running 1 65m 10.244.2.133 <none> <none>
druid-historical-0 1/1 Running 0 65m 10.244.3.143 <none> <none>
druid-middle-manager-0 1/1 Running 0 65m 10.244.3.144 <none> <none>
druid-middle-manager-1 1/1 Running 0 66m 10.244.3.146 <none> <none>
druid-middle-manager-2 1/1 Running 0 67m 10.244.3.147 <none> <none>
druid-mysql-6764889c67-f7l5r 1/1 Running 0 65m 10.244.2.131 <none> <none>
druid-overlord-5fcd7c49cd-nh764 1/1 Running 1 65m 10.244.3.142 <none> <none>
druid-zookeeper-0 1/1 Running 0 65m 10.244.2.132 <none> <none>
druid-zookeeper-1 1/1 Running 0 47h 10.244.3.145 <none> <none>
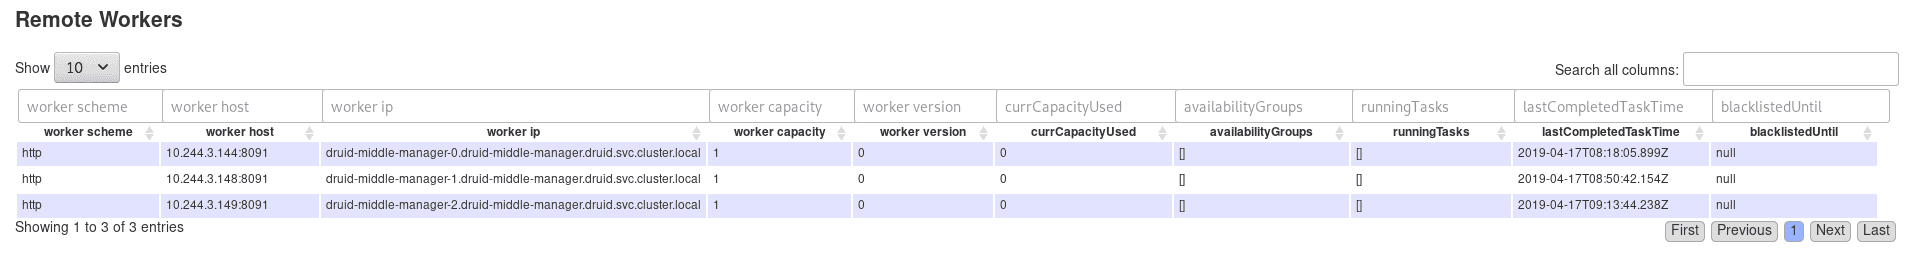
druid-zookeeper-2 1/1 Running 0 65m 10.244.1.147 <none> <none>As we can see, we have 3 Middlemanagers, so we are in a nominal situation with our currentReplicas in the previous calculation.
The Coordinator web UI can confirm that:
To get started, we will use stefanprodan’s k8s-prom-hpa GitHub project as it is an excellent starting point for using the HPA with custom metrics from Prometheus. It contains most resources we need for this use case.
Let’s create a Prometheus deployment in our Kubernetes cluster:
kubectl create -f prometheus/
configmap/prometheus-config created
deployment.apps/prometheus created
clusterrole.rbac.authorization.k8s.io/prometheus created
serviceaccount/prometheus created
clusterrolebinding.rbac.authorization.k8s.io/prometheus created
service/prometheus created
Our Prometheus is now accessible through the configured port in ./prometheus/prometheus-svc.yaml (31990):
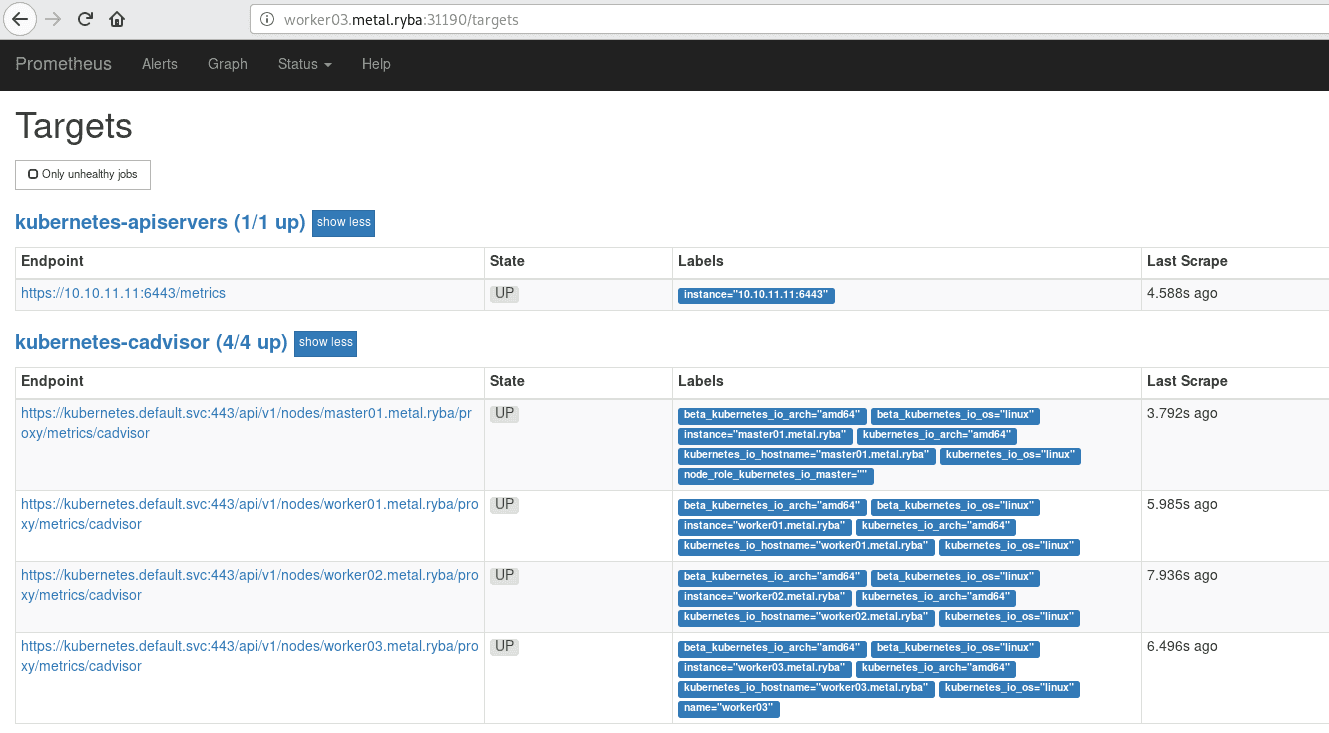
We can see in the “Graph” tab that we already have a lot of cool metrics from Kubernetes: CPU Usage, Memory Usage, Disk Usage, etc. It is because Prometheus’s scrapers are configured to read directly from Kubernetes’s REST API using ./prometheus/prometheus-cfg.yaml.
There are also additional configurations to modify the labeling and names of the metrics.
These metrics are nice but there is nothing yet that would allow us to automatically scale Druid based on the pre-requisites of our previous example.
We now need to gather metrics from Druid and get Prometheus to scrape them.
For this purpose and as it is only a POC and not something I want to run in production, I wrote a really simple Prometheus exporter to expose just one metric, here is the code:
http = require('http')
axios = require('axios')

get_num_pending_tasks = () ->
  axios.get "http://#{env.HOST}:#{env.PORT}/druid/indexer/v1/pendingTasks"
    .then (response) ->
      return response.data.length

server = http.createServer (req, res) ->
  res.writeHead 200
  res.end """
    container_druid_num_pending_tasks #{await get_num_pending_tasks()}
  """
  return
server.listen 8080
Then we can configure a Prometheus scraper to fetch these metrics, this will happen in ./prometheus/prometheus-cfg.yml as the config file (/etc/prometheus/prometheus.yml) of the Prometheus deployment we launched on Kubernetes is defined with a ConfigMap:
...
- job_name: 'druid_prometheus_exporter'
metrics_path: /
scheme: http
static_configs:
- targets:
- edge01.metal.ryba:49160
labels:
container_name: 'druid'
pod_name: 'druid-middle-manager-0'
namespace: 'druid'
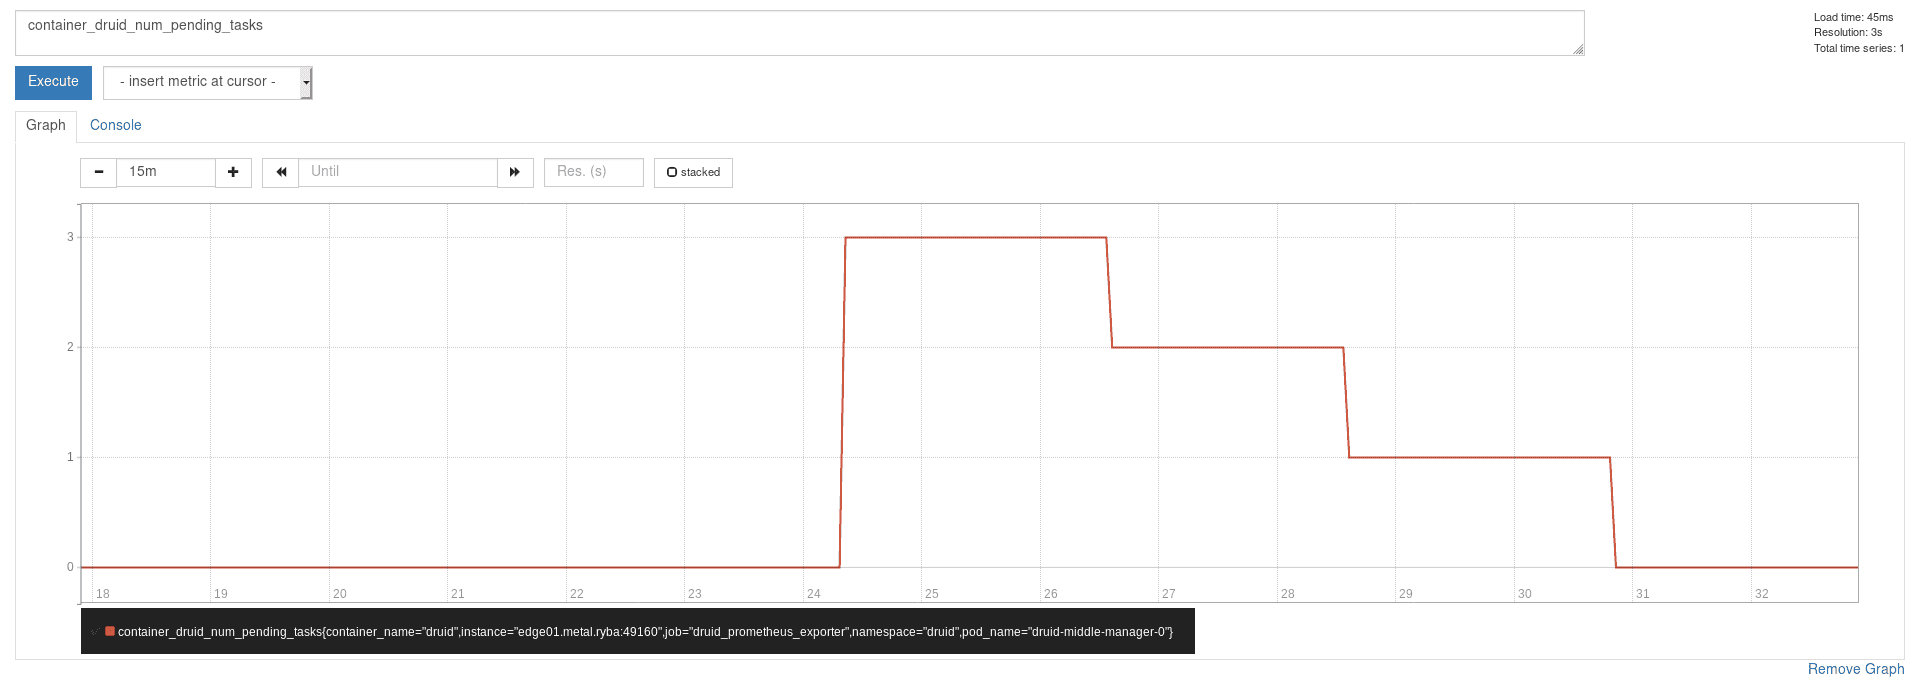
...Notice that we are telling Prometheus to add labels to these metrics.
After restarting Prometheus, we can see the metric showing up in Prometheus:
Now we are ready to deploy the Prometheus adapter:
kubectl create -f custom-metrics-api/
secret/cm-adapter-serving-certs created
clusterrolebinding.rbac.authorization.k8s.io/custom-metrics:system:auth-delegator create
rolebinding.rbac.authorization.k8s.io/custom-metrics-auth-reader created
deployment.extensions/custom-metrics-apiserver create
clusterrolebinding.rbac.authorization.k8s.io/custom-metrics-resource-reader created
serviceaccount/custom-metrics-apiserver created
service/custom-metrics-apiserver created
apiservice.apiregistration.k8s.io/v1beta1.custom.metrics.k8s.io created
clusterrole.rbac.authorization.k8s.io/custom-metrics-server-resources created
clusterrole.rbac.authorization.k8s.io/custom-metrics-resource-reader created
clusterrolebinding.rbac.authorization.k8s.io/hpa-controller-custom-metrics created
The adapter queries the metrics from Prometheus, parse them and makes them available via the custom metrics API. Let’s see if we can fetch our metric:
kubectl get --raw "/api/custom.metrics.k8s.io/v1beta1/namespaces/druid/pods/*/druid_num_pending_tasks"
{"kind": "MetricValueList","apiVersion":"custom.metrics.k8s.io/v1beta1","metadata":{"selfLink":"/apis/custom.metrics.k8s.io/v1beta1/namespaces/druid/pods/%2A/druid_num_pending_tasks"},"items":[{"describedObject":{"kind":"Pod","namespace":"druid","name":"druid-middle-manager-0","apiVersion":"/__internal"},"metricName":"druid_num_pending_tasks","timestamp":"2019-04-17T13:08:45Z","value":"3"}]}
It works, we can see that the number of pending tasks (currently 3) is now a native Kubernetes metric.
We can now create the Horizontal Pod AutoScaler, here is what it looks like:
---
apiVersion: autoscaling/v2beta1
kind: HorizontalPodAutoscaler
metadata:
  namespace: druid
  name: druid-mm
spec:
  scaleTargetRef:
    apiVersion: apps/v1
    kind: StatefulSet
    name: druid-middle-manager
  minReplicas: 3
  maxReplicas: 16
  metrics:
  - type: Pods
    pods:
      metricName: druid_num_pending_tasks
      targetAverageValue: 5
It is pretty straightforward, we just need to define the followings:
- A name for the HPA.
- A target on which it will apply: here, our druid-middle-manager StatefulSet.
- A min and max number of replicas: this is useful to avoid the HPA to scale like crazy in a direction or the other and getting things out of hands.
- A metric with it’s preferred value, from which the HPA will compute the number of preferred replicas.
A few seconds after creating the HPA, we can describe this Kubernetes resource to see how it is behaving:
We currently have 4 tasks pending, the HPA tells us that it is acceptable compared to the objective (targetAverageValue) that we have set:
kubectl describe -f druid/middlemanager-hpa.yaml
Name:                                 druid-mm
Namespace:                            druid
Labels:                               <none>
Annotations:                          <none>
CreationTimestamp:                    Wed, 17 Apr 2019 13:41:50 +0000
Reference:                            StatefulSet/druid-middle-manager
Metrics:                              ( current / target )
  "druid_num_pending_tasks" on pods:  4 / 5
Min replicas:                         1
Max replicas:                         16
StatefulSet pods:                     3 current / 3 desired
Conditions:
  Type            Status  Reason              Message
  ----            ------  ------              --------
  AbleToScale     True    ReadyForNewScale    recommended size matches current size
  ScalingActive   True    ValidMetricFound    the HPA was able to successfully calculate a replica count from pods metric druid_num_pending_tasks
  ScalingLimited  False   DesiredWithinRange  the desired count is within the acceptable range
Events:           <none>
Now let’s try to push our Druid a bit further by triggering a lot of ingestion tasks at the same time. After a few seconds, the HPA describe should look like this:
kubectl describe hpa druid-mm -n druid
Name:                                 druid-mm
Namespace:                            druid
Labels:                               <none>
Annotations:                          <none>
CreationTimestamp:                    Wed, 17 Apr 2019 13:59:33 +0000
Reference:                            StatefulSet/druid-middle-manager
Metrics:                              ( current / target )
  "druid_num_pending_tasks" on pods:  25 / 5
Min replicas:                         1
Max replicas:                         16
StatefulSet pods:                     3 current / 6 desired
Conditions:
  Type            Status  Reason              Message
  ----            ------  ------              --------
  AbleToScale     True    SucceededRescale    the HPA controller was able to update the target scale to 6
  ScalingActive   True    ValidMetricFound    the HPA was able to successfully calculate a replica count from pods metric druid_num_pending_tasks
  ScalingLimited  True   ScaleUpLimit  the desired replica count is increasing faster than the maximum scale rate
Events:           <none>
And finally after waiting a few more seconds:
kubectl get pods -n druid -o wide
NAME                                READY  STATUS       RESTARTS   AGE     IP            NOMINATED NODE  READINESS GATES
druid-broker-5c6b4dd495-ppmvx       1/1    Running      66         47h     10.244.3.141  <none>          <none>
druid-coordinator-748f4fd656-vkvjq  1/1    Running      1          47h     10.244.2.133  <none>          <none>
druid-historical-0                  1/1    Running      40         47h     10.244.3.143  <none>          <none>
druid-middle-manager-0              1/1    Running      3          47h     10.244.3.144  <none>          <none>
druid-middle-manager-1              1/1    Running      0          5h38m   10.244.3.148  <none>          <none>
druid-middle-manager-2              1/1    Running      0          30m     10.244.3.150  <none>          <none>
druid-middle-manager-3              1/1    Running      0          5m      10.244.3.150  <none>          <none>
druid-middle-manager-4              1/1    Running      0          4m      10.244.3.150  <none>          <none>
druid-middle-manager-5              1/1    Running      0          3m      10.244.3.150  <none>          <none>
druid-mysql-6764889c67-f7l5r        1/1    Running      0          47h     10.244.2.131  <none>          <none>
druid-overlord-5fcd7c49cd-nh764     1/1    Running      0          47h     10.244.3.142  <none>          <none>
druid-zookeeper-0                   1/1    Running      0          47h     10.244.2.132  <none>          <none>
druid-zookeeper-1                   1/1    Running      0          47h     10.244.3.145  <none>          <none>
druid-zookeeper-2                   1/1    Running      0          47h     10.244.1.147  <none>          <none>
We did it! The StatefulSet has been scaled up and we now have 6 Middlemanagers up and running to balance the load.
What’s next?
As this demo proved, the auto-scaling of Druid with Kubernetes is possible but there are a few things we could have done better. For starters, we could (and should) have a better Prometheus exporters for Druid’s metrics like the one we used in the demo is very limited. This project from Wikimedia seems interesting, it is a configurable endpoint for Druid’s http-emiter-module, receives the metrics and exposes them in a Prometheus friendly format. This python app would have to be Dockerized in order to run alongside our cluster in Kubernetes. The Helm chart we used to deploy Druid could also use a little re-work to be tweakable enough to support this configuration.
The HPA we configured scaled the MiddleManagers for ingestion data. We could also imagine a similar process for the querying of these data. By monitoring the read metrics of the cluster, we could automatically scale the Druid Historical role to serve more clients at the same time.
HPA is a good solution for auto-scaling Druid but it is not really viable for existing bare metal Druid cluster. Hopefully, the development team behind the project will come up with a more open implementation than the EC2 one.
