


HDP cluster monitoring

Jul 5, 2017
- Categories
- Big Data
- DevOps & SRE
- Infrastructure
- Tags
- Alert
- Ambari
- Metrics
- Monitoring
- HDP
- REST [more][less]
Never miss our publications about Open Source, big data and distributed systems, low frequency of one email every two months.
With the current growth of BigData technologies, more and more companies are building their own clusters in hope to get some value of their data. One main concern while building these infrastructures is the capacity to continuously monitor the cluster’s health and report issues as fast as possible. This is where monitoring comes in.
There are almost as many monitoring policies as there are different companies. Most of them have their own monitoring tools, and Big Data clusters have to be adapted to them. This article covers the integration of an HDP 2.4.2 cluster into one of our customers’ monitoring process.
Ambari-Alerts: HDP’s monitoring solution
On an HDP solution, there’s a lot of stuff that can have an impact on the global cluster’s health, from the multiple components’ processes on the platform, to the communication through the network, including nodes’ CPU, RAM, and FS usage.
Ambari already monitors most of these and exposes their statuses with its Ambari-Alerts’ REST API. Alerts can be customized to fit the company’s needs, and custom alerts can be added to handle components that may not be supervised by ambari’s default alerts.
To list all available alerts definitions on your cluster, use:
curl -u $user:$password -H 'X-Requested-By: ambari' \
  http://$ambari_server:$ambari_port/api/v1/clusters/$cluster_name/alert_definitions/
This will print about 70 default alerts already enabled and reporting various health statuses on Ambari’s web-UI. Some parameters, like the check interval or criticity thresholds, can be directly changed on the Alert tab of the web-UI. To visualize and/or change more alert-specific parameters, use:
curl -u $user:$password -H 'X-Requested-By: ambari' \
  http://$ambari_server:$ambari_port/api/v1/clusters/$cluster_name/alerts
This will return something like:
{
  "href" : "http://$ambari_server:$ambari_port/api/v1/clusters/$cluster_name/alerts/71",
  "Alert" : {
    "cluster_name" : "$cluster_name",
    "component_name" : "DATANODE",
    "definition_id" : 18,
    "definition_name" : "datanode_heap_usage",
    "host_name" : "$datanode_hostname",
    "id" : 71,
    "instance" : null,
    "label" : "DataNode Heap Usage",
    "latest_timestamp" : 1475137438564,
    "maintenance_state" : "OFF",
    "original_timestamp" : 1473843838579,
    "scope" : "HOST",
    "service_name" : "HDFS",
    "state" : "OK",
    "text" : "Used Heap:[6%, 55.806114 MB], Max Heap: 1004.0 MB"
  }
}
Monitoring at our customer
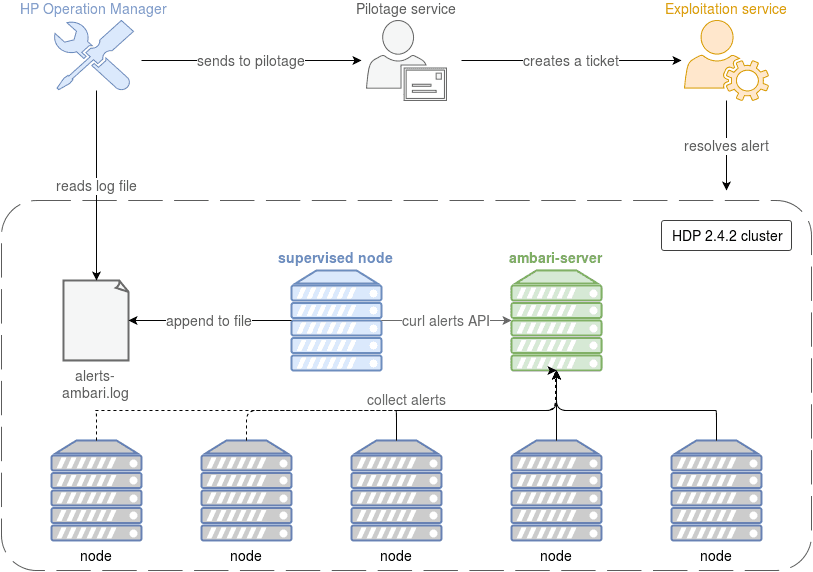
While Ambari’s alerts already enable full cluster monitoring through its web-UI, it doesn’t fit our customer’s policies. A single “pilotage” team has to monitor all of the company’s environments, and fill an issue when an alert appears. The issue is attributed to the right exploitation team who then works on resolving the issue.
The monitoring solution used here is HP’s Operation-Manager. All environments have to provide their health checks in a way HP-OM can access.
In our case, we decided to provide a log file on which we append regularly all of ambari’s alerts information. We used a custom python script to request each enabled ambari alert status with its REST API, and print it on one line in the log file.
HP-OM reads each new line appended to the log file, searches for the keywords CRITICAL or UNKNOWN, and sends the line to the pilotage team if one of these terms appears. The pilotage member that receives the alert creates an issue and puts the log line in the description of it. Finally, the exploitation team affected to the environment on which the alert appeared treats the issue with the help of the log line in the description.
Additional information
Ambari-Alerts isn’t the only way to get information on your cluster’s health. In fact, it is built in a way that enables a lot of customization. You can write your own scripts to get the information you want and integrate it as an alert in ambari. This keeps your monitoring process in one place. But you can also use other sources of information.
One example is Ambari-Metrics. When it is enabled, each HDP service and host metric is monitored by Ambari-Metrics, and the result can be seen on a Grafana web-UI or queried through its REST API. Global cluster metrics are also available.
To get a list of the services’ metrics monitored by Ambari-Metrics, use:
curl -u $user:$password -H 'X-Requested-By: ambari' http://$ambari_server:$ambari_port/api/v1/stacks/HDP/versions/2.4/services/ACCUMULO/artifacts/metrics_descriptor > metrics-descriptor_accumulo.json
curl -u $user:$password -H 'X-Requested-By: ambari' http://$ambari_server:$ambari_port/api/v1/stacks/HDP/versions/2.4/services/AMBARI_METRICS/artifacts/metrics_descriptor > metrics-descriptor_ambari-metrics.json
curl -u $user:$password -H 'X-Requested-By: ambari' http://$ambari_server:$ambari_port/api/v1/stacks/HDP/versions/2.4/services/ATLAS/artifacts/metrics_descriptor > metrics-descriptor_atlas.json
curl -u $user:$password -H 'X-Requested-By: ambari' http://$ambari_server:$ambari_port/api/v1/stacks/HDP/versions/2.4/services/FALCON/artifacts/metrics_descriptor > metrics-descriptor_falcon.json
curl -u $user:$password -H 'X-Requested-By: ambari' http://$ambari_server:$ambari_port/api/v1/stacks/HDP/versions/2.4/services/FLUME/artifacts/metrics_descriptor > metrics-descriptor_flume.json
curl -u $user:$password -H 'X-Requested-By: ambari' http://$ambari_server:$ambari_port/api/v1/stacks/HDP/versions/2.4/services/GANGLIA/artifacts/metrics_descriptor > metrics-descriptor_ganglia.json
curl -u $user:$password -H 'X-Requested-By: ambari' http://$ambari_server:$ambari_port/api/v1/stacks/HDP/versions/2.4/services/HBASE/artifacts/metrics_descriptor > metrics-descriptor_hbase.json
curl -u $user:$password -H 'X-Requested-By: ambari' http://$ambari_server:$ambari_port/api/v1/stacks/HDP/versions/2.4/services/HDFS/artifacts/metrics_descriptor > metrics-descriptor_hdfs.json
curl -u $user:$password -H 'X-Requested-By: ambari' http://$ambari_server:$ambari_port/api/v1/stacks/HDP/versions/2.4/services/HIVE/artifacts/metrics_descriptor > metrics-descriptor_hive.json
curl -u $user:$password -H 'X-Requested-By: ambari' http://$ambari_server:$ambari_port/api/v1/stacks/HDP/versions/2.4/services/KAFKA/artifacts/metrics_descriptor > metrics-descriptor_kafka.json
curl -u $user:$password -H 'X-Requested-By: ambari' http://$ambari_server:$ambari_port/api/v1/stacks/HDP/versions/2.4/services/KERBEROS/artifacts/metrics_descriptor > metrics-descriptor_kerberos.json
curl -u $user:$password -H 'X-Requested-By: ambari' http://$ambari_server:$ambari_port/api/v1/stacks/HDP/versions/2.4/services/KNOX/artifacts/metrics_descriptor > metrics-descriptor_knox.json
curl -u $user:$password -H 'X-Requested-By: ambari' http://$ambari_server:$ambari_port/api/v1/stacks/HDP/versions/2.4/services/MAHOUT/artifacts/metrics_descriptor > metrics-descriptor_mahout.json
curl -u $user:$password -H 'X-Requested-By: ambari' http://$ambari_server:$ambari_port/api/v1/stacks/HDP/versions/2.4/services/MAPREDUCE2/artifacts/metrics_descriptor > metrics-descriptor_mapreduce2.json
curl -u $user:$password -H 'X-Requested-By: ambari' http://$ambari_server:$ambari_port/api/v1/stacks/HDP/versions/2.4/services/OOZIE/artifacts/metrics_descriptor > metrics-descriptor_oozie.json
curl -u $user:$password -H 'X-Requested-By: ambari' http://$ambari_server:$ambari_port/api/v1/stacks/HDP/versions/2.4/services/PIG/artifacts/metrics_descriptor > metrics-descriptor_pig.json
curl -u $user:$password -H 'X-Requested-By: ambari' http://$ambari_server:$ambari_port/api/v1/stacks/HDP/versions/2.4/services/RANGER/artifacts/metrics_descriptor > metrics-descriptor_ranger.json
curl -u $user:$password -H 'X-Requested-By: ambari' http://$ambari_server:$ambari_port/api/v1/stacks/HDP/versions/2.4/services/RANGER_KMS/artifacts/metrics_descriptor > metrics-descriptor_ranger-kms.json
curl -u $user:$password -H 'X-Requested-By: ambari' http://$ambari_server:$ambari_port/api/v1/stacks/HDP/versions/2.4/services/SLIDER/artifacts/metrics_descriptor > metrics-descriptor_slider.json
curl -u $user:$password -H 'X-Requested-By: ambari' http://$ambari_server:$ambari_port/api/v1/stacks/HDP/versions/2.4/services/SMARTSENSE/artifacts/metrics_descriptor > metrics-descriptor_smartsense.json
curl -u $user:$password -H 'X-Requested-By: ambari' http://$ambari_server:$ambari_port/api/v1/stacks/HDP/versions/2.4/services/SPARK/artifacts/metrics_descriptor > metrics-descriptor_spark.json
curl -u $user:$password -H 'X-Requested-By: ambari' http://$ambari_server:$ambari_port/api/v1/stacks/HDP/versions/2.4/services/SQOOP/artifacts/metrics_descriptor > metrics-descriptor_sqoop.json
curl -u $user:$password -H 'X-Requested-By: ambari' http://$ambari_server:$ambari_port/api/v1/stacks/HDP/versions/2.4/services/STORM/artifacts/metrics_descriptor > metrics-descriptor_storm.json
curl -u $user:$password -H 'X-Requested-By: ambari' http://$ambari_server:$ambari_port/api/v1/stacks/HDP/versions/2.4/services/TEZ/artifacts/metrics_descriptor > metrics-descriptor_tez.json
curl -u $user:$password -H 'X-Requested-By: ambari' http://$ambari_server:$ambari_port/api/v1/stacks/HDP/versions/2.4/services/YARN/artifacts/metrics_descriptor > metrics-descriptor_yarn.json
curl -u $user:$password -H 'X-Requested-By: ambari' http://$ambari_server:$ambari_port/api/v1/stacks/HDP/versions/2.4/services/ZOOKEEPER/artifacts/metrics_descriptor > metrics-descriptor_zookeeper.json
Those metrics can then be used as sources to create more custom alerts. It was not implemented for customer’s use case because the default alerts were enough to handle the needs. However, the solution was still studied and may be implemented in the future if the monitoring requirements of the company evolve.
